See it: Air temperatures and pollution around the world are captured in real time in these animated weather maps
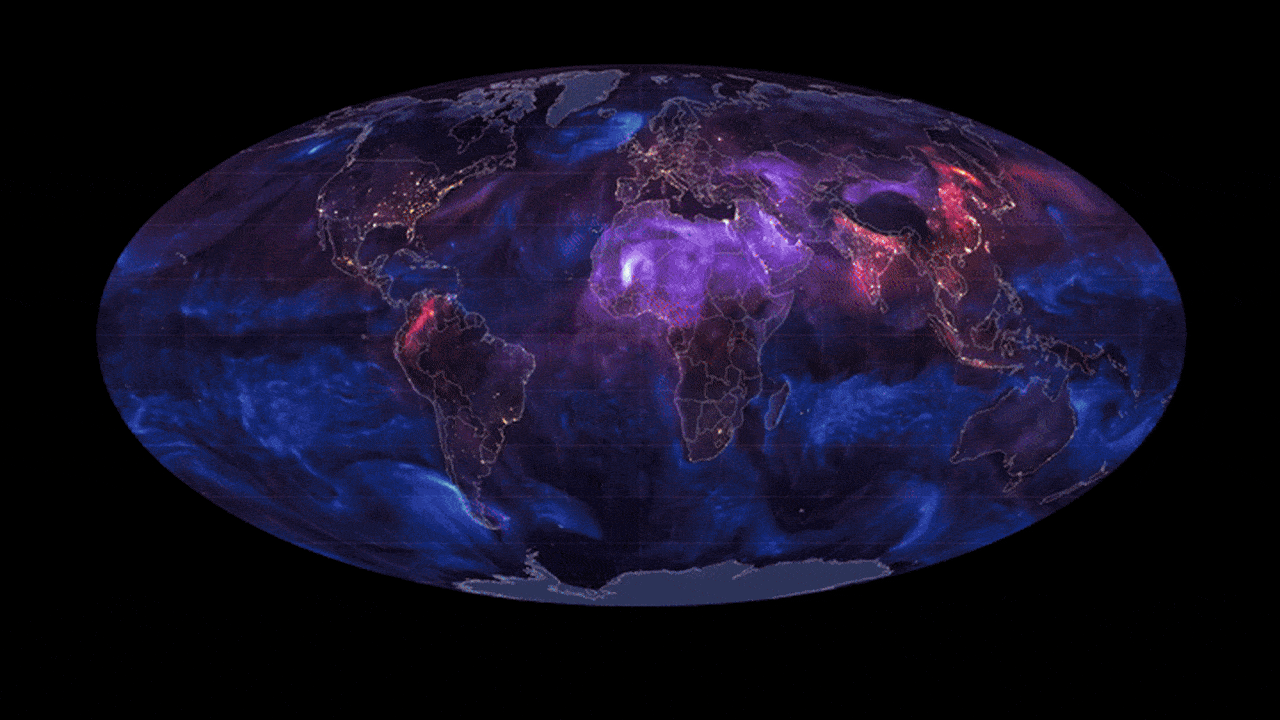
A typical map of temperatures across the planet shows just a snapshot in time, listing the day’s various highs and lows. But temperature isn’t static; it rises and falls, and it’s influenced by all sorts of systems, from ocean currents to solar radiation. An animated map from Maps.com shows those variations, revealing the patterns that swirl around our planet—and depicting the gradual way Earth heats up from east to west as the sun rises and sets. [Image: Maps.com] The animated map is part of a new feature called Earth in Action, through which Maps.com (a platform by spatial analytics com...
Read Full Article at www.fastcompany.com
Original story published by www.fastcompany.com. Peanutlife curates and shares uplifting news to brighten your day.